Hello ggplot2.SparkR
SparkR requires no additional training for existing R users who are already familiar with ggplot2 and allows them to benefit from powerful distributed processing capabilities of Spark for efficient visualization of big data.
ggplot(data, aes(x = Item, fill = Payment)) + geom_bar()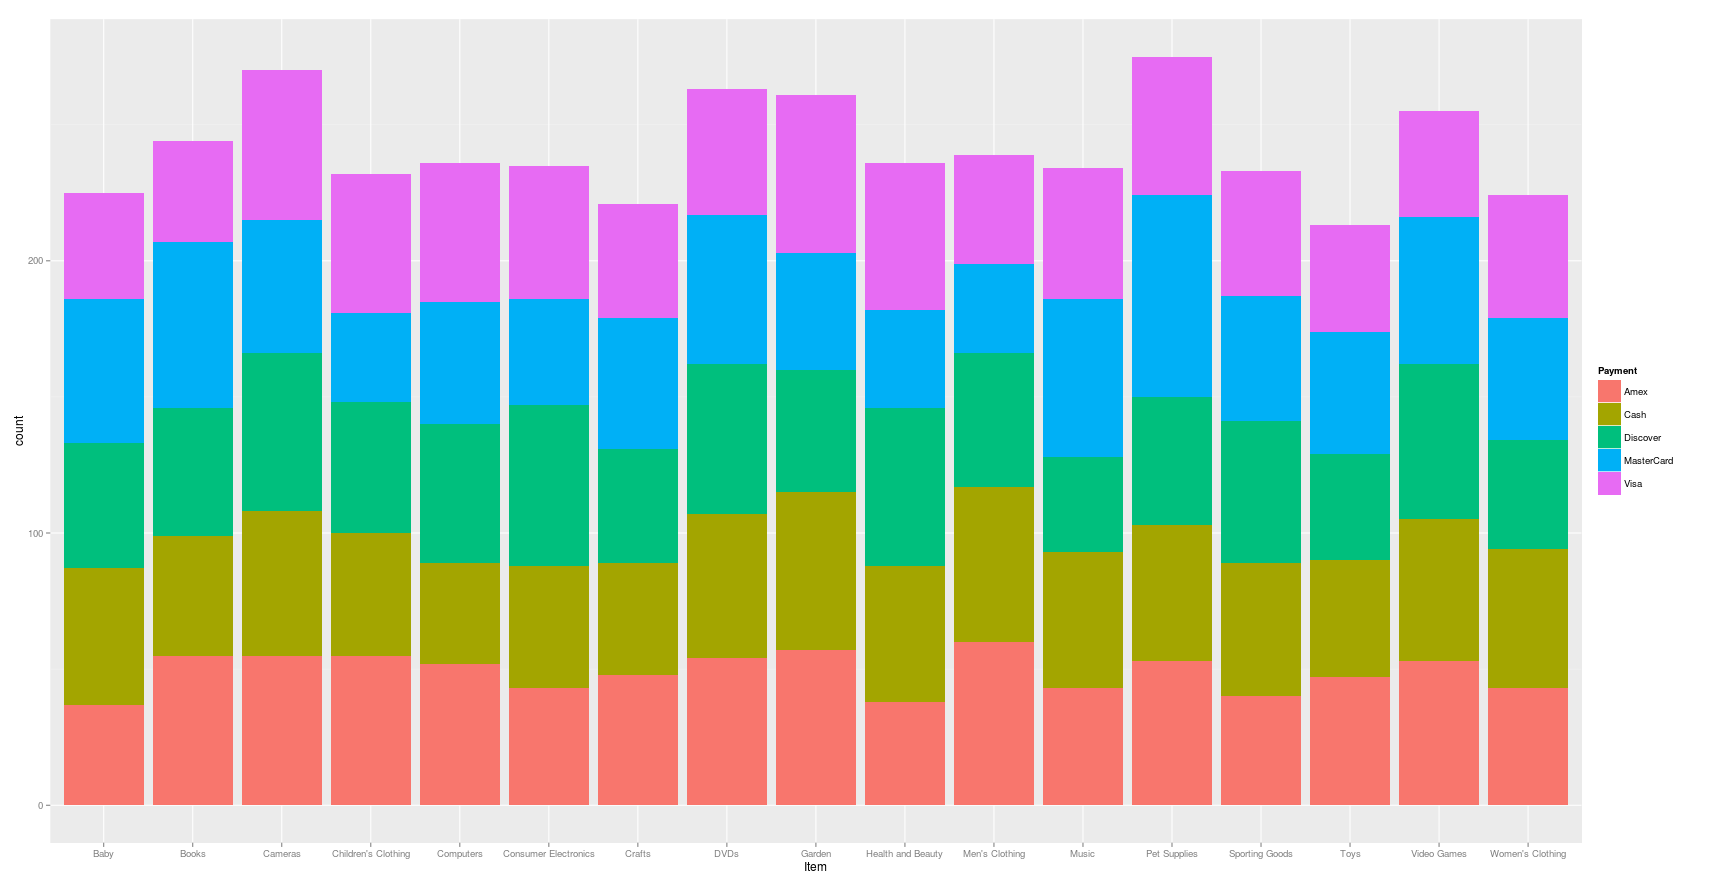
The parameter data in examples can be either R data.frame or Spark DataFrame.
If the input data is Spark DataFrame, heavyweight data processing stages are offloaded to the Spark backend using the SparkR API.